Insights
SwissReach is no longer only a rail-isochrone project. The current analysis asks a more practical question:
What does Swiss public transport accessibility buy you in terms of everyday infrastructure and retail choice?
Project Note
This project was defined and a substantial share of the exploratory work was completed before the EPFL COM-490 assignment was released. Unfortunately, the original idea, a Swiss public-transport accessibility visualization project, overlapped very closely with Assignment 1 of COM-490 Large-Scale Data Science in the Real World.
To avoid any ambiguity about similarity between the two projects, SwissReach was deliberately extended with infrastructure-count and retail-density layers. This pivot keeps the transport backbone of the project, but uses it to tell more distinctive stories about daily life, service access, and regional retail structure in Switzerland.
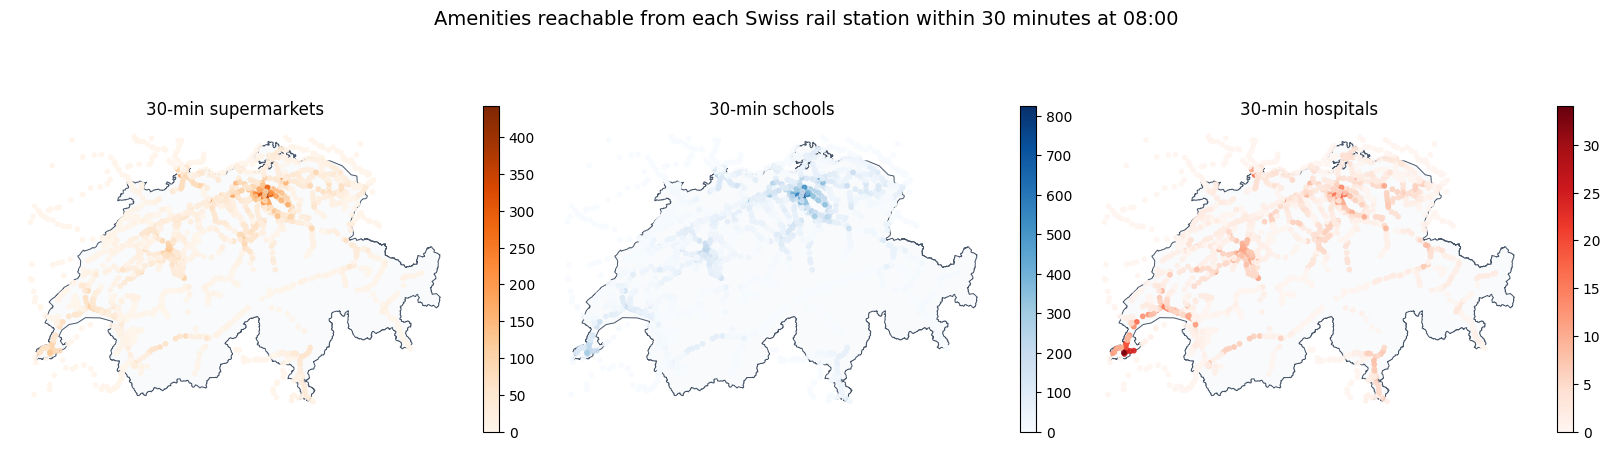
View 1: What Can You Reach In 30 Minutes?
The first view translates the rail graph into counts of useful destinations. For every logical rail station, SwissReach computes how many of the following are reachable within 30 minutes from a fixed 08:00 departure:
- supermarkets
- schools
- hospitals
The current export covers 3,430 supermarket POIs, 6,112 schools, and 305 hospitals. This gives a more intuitive accessibility measure than travel time alone. It distinguishes stations that may be equally central in the rail network, but very different in terms of what a resident can actually reach.
Relevant export:
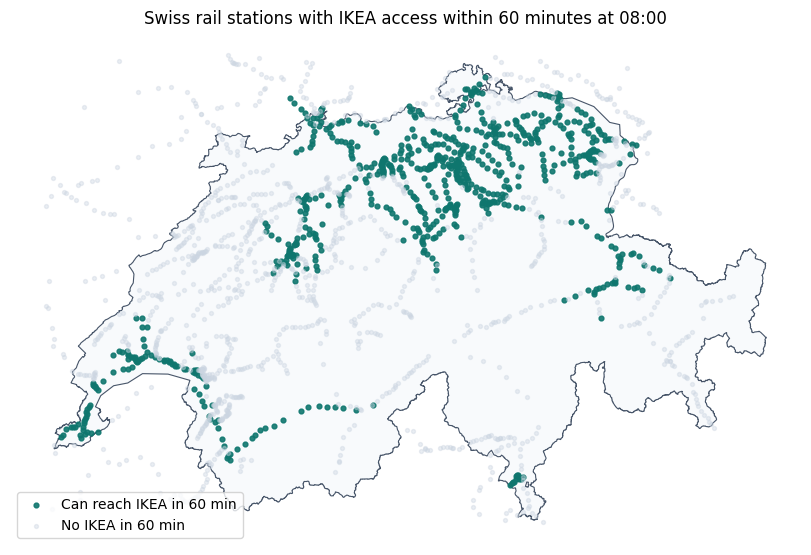
View 2: Which Places Can Reach IKEA Within 1 Hour?
IKEA is a deliberately different destination type: a sparse, large-format retail network rather than an everyday amenity. Mapping 60-minute IKEA access highlights which parts of Switzerland are well connected to destination retail by public transport and which remain far from it.
This view is useful because it emphasizes the difference between dense daily infrastructure and rare regional destinations. In the current export, 21 IKEA POIs are detected and 743 logical rail stations can reach at least one IKEA within 60 minutes.
Relevant exports:
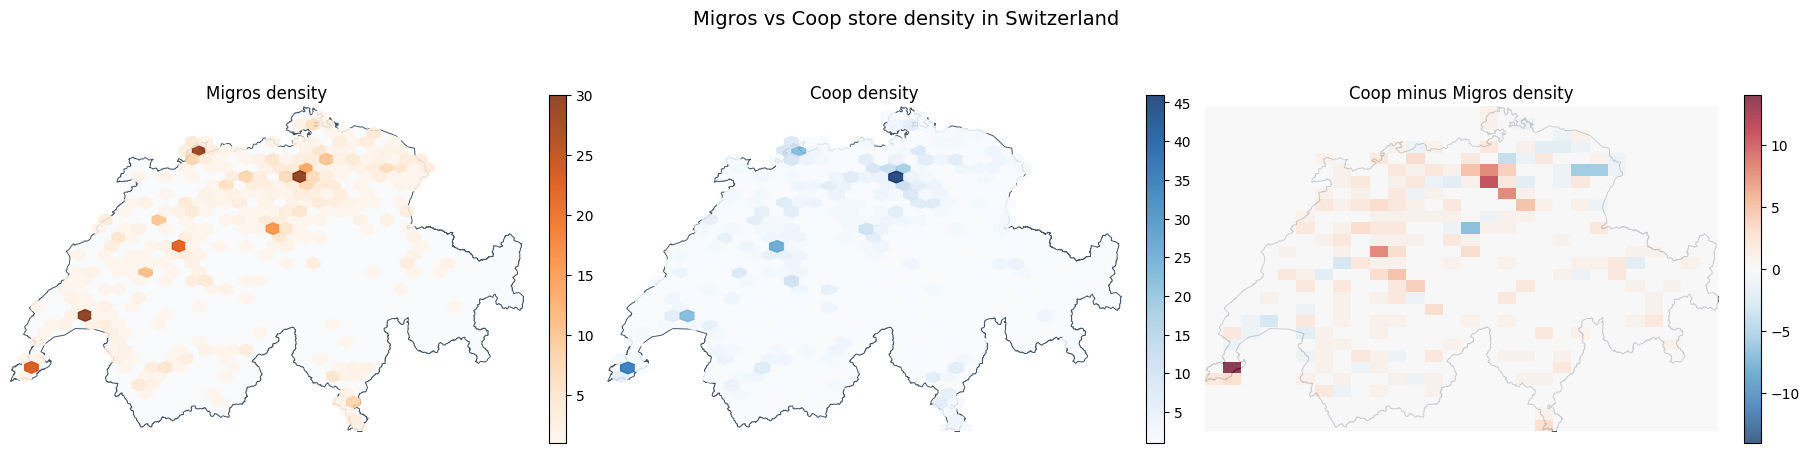
View 3: Migros vs Coop
The supermarket dataset makes it possible to move from pure accessibility to retail geography. A national density comparison between Migros and Coop shows where both brands overlap heavily, and where one network appears denser than the other. In the current OSM-based export, Coop contributes 943 stores and Migros contributes 743.
This view works well alongside the accessibility layers because it shifts the question from where can I get to? to what kind of retail structure exists when I get there?
Relevant exports:
Interpretation Notes
These views are intentionally comparative rather than fully door-to-door realistic.
- Reachability is computed on the rail timetable backbone with a fixed departure time of
08:00. - Schools, hospitals, IKEA, and supermarkets are assigned to the nearest logical rail station as a visualization-friendly proxy.
- OpenStreetMap amenity coverage is useful at national scale, but not a perfect census of every Swiss facility.
Those constraints are acceptable for the project because the goal is to support country-scale accessibility analysis, not to replace a production journey planner or an official facility register.