Milestone 1 Report
This document follows the four sections requested in README.md: Dataset, Problematic, Exploratory Data Analysis, and Related work.
Project Note
SwissReach was defined and partly explored before the EPFL COM-490 assignment was released. Once the overlap with a pure public-transport accessibility study became clear, the project was extended with infrastructure-count and retail-density layers. The result keeps the Swiss rail backbone but adds a more distinctive story about everyday access.
Dataset
SwissReach combines three public data families:
- Swiss GTFS static timetable from
opentransportdata.swiss - SwissBoundaries3D national boundary geometry from
swisstopo - OpenStreetMap POIs plus exported supermarket records for the amenity layers
The project therefore relies on structured public datasets rather than scraping. The main preprocessing work is to keep only the relevant national rail network and convert raw stop/platform entries into visualization-friendly logical stations.
| Stage | Count |
|---|---|
| Raw GTFS stops | 95,415 |
| Stops inside Switzerland | 75,775 |
| Rail stop entries | 4,105 |
| Logical rail stations | 1,938 |
This scope is manageable for the course: the data are rich enough to support several views, but still narrow enough to validate and explain clearly.
Problematic
The central question is:
How does rail accessibility vary across Switzerland, and what does that accessibility buy in terms of everyday infrastructure and retail choice?
Milestone 1 deliberately keeps a rail-first scope. This matches the current implementation, avoids the much higher cleaning cost of the full multimodal feed, and already produces a meaningful national story. The target audience is students, commuters, and readers interested in regional inequality in public transport and daily services.
The project becomes more original once accessibility is no longer shown only as travel time. SwissReach uses the rail network as a backbone, then connects it to supermarkets, schools, hospitals, IKEA access, and Migros-vs-Coop retail structure.
Exploratory Data Analysis
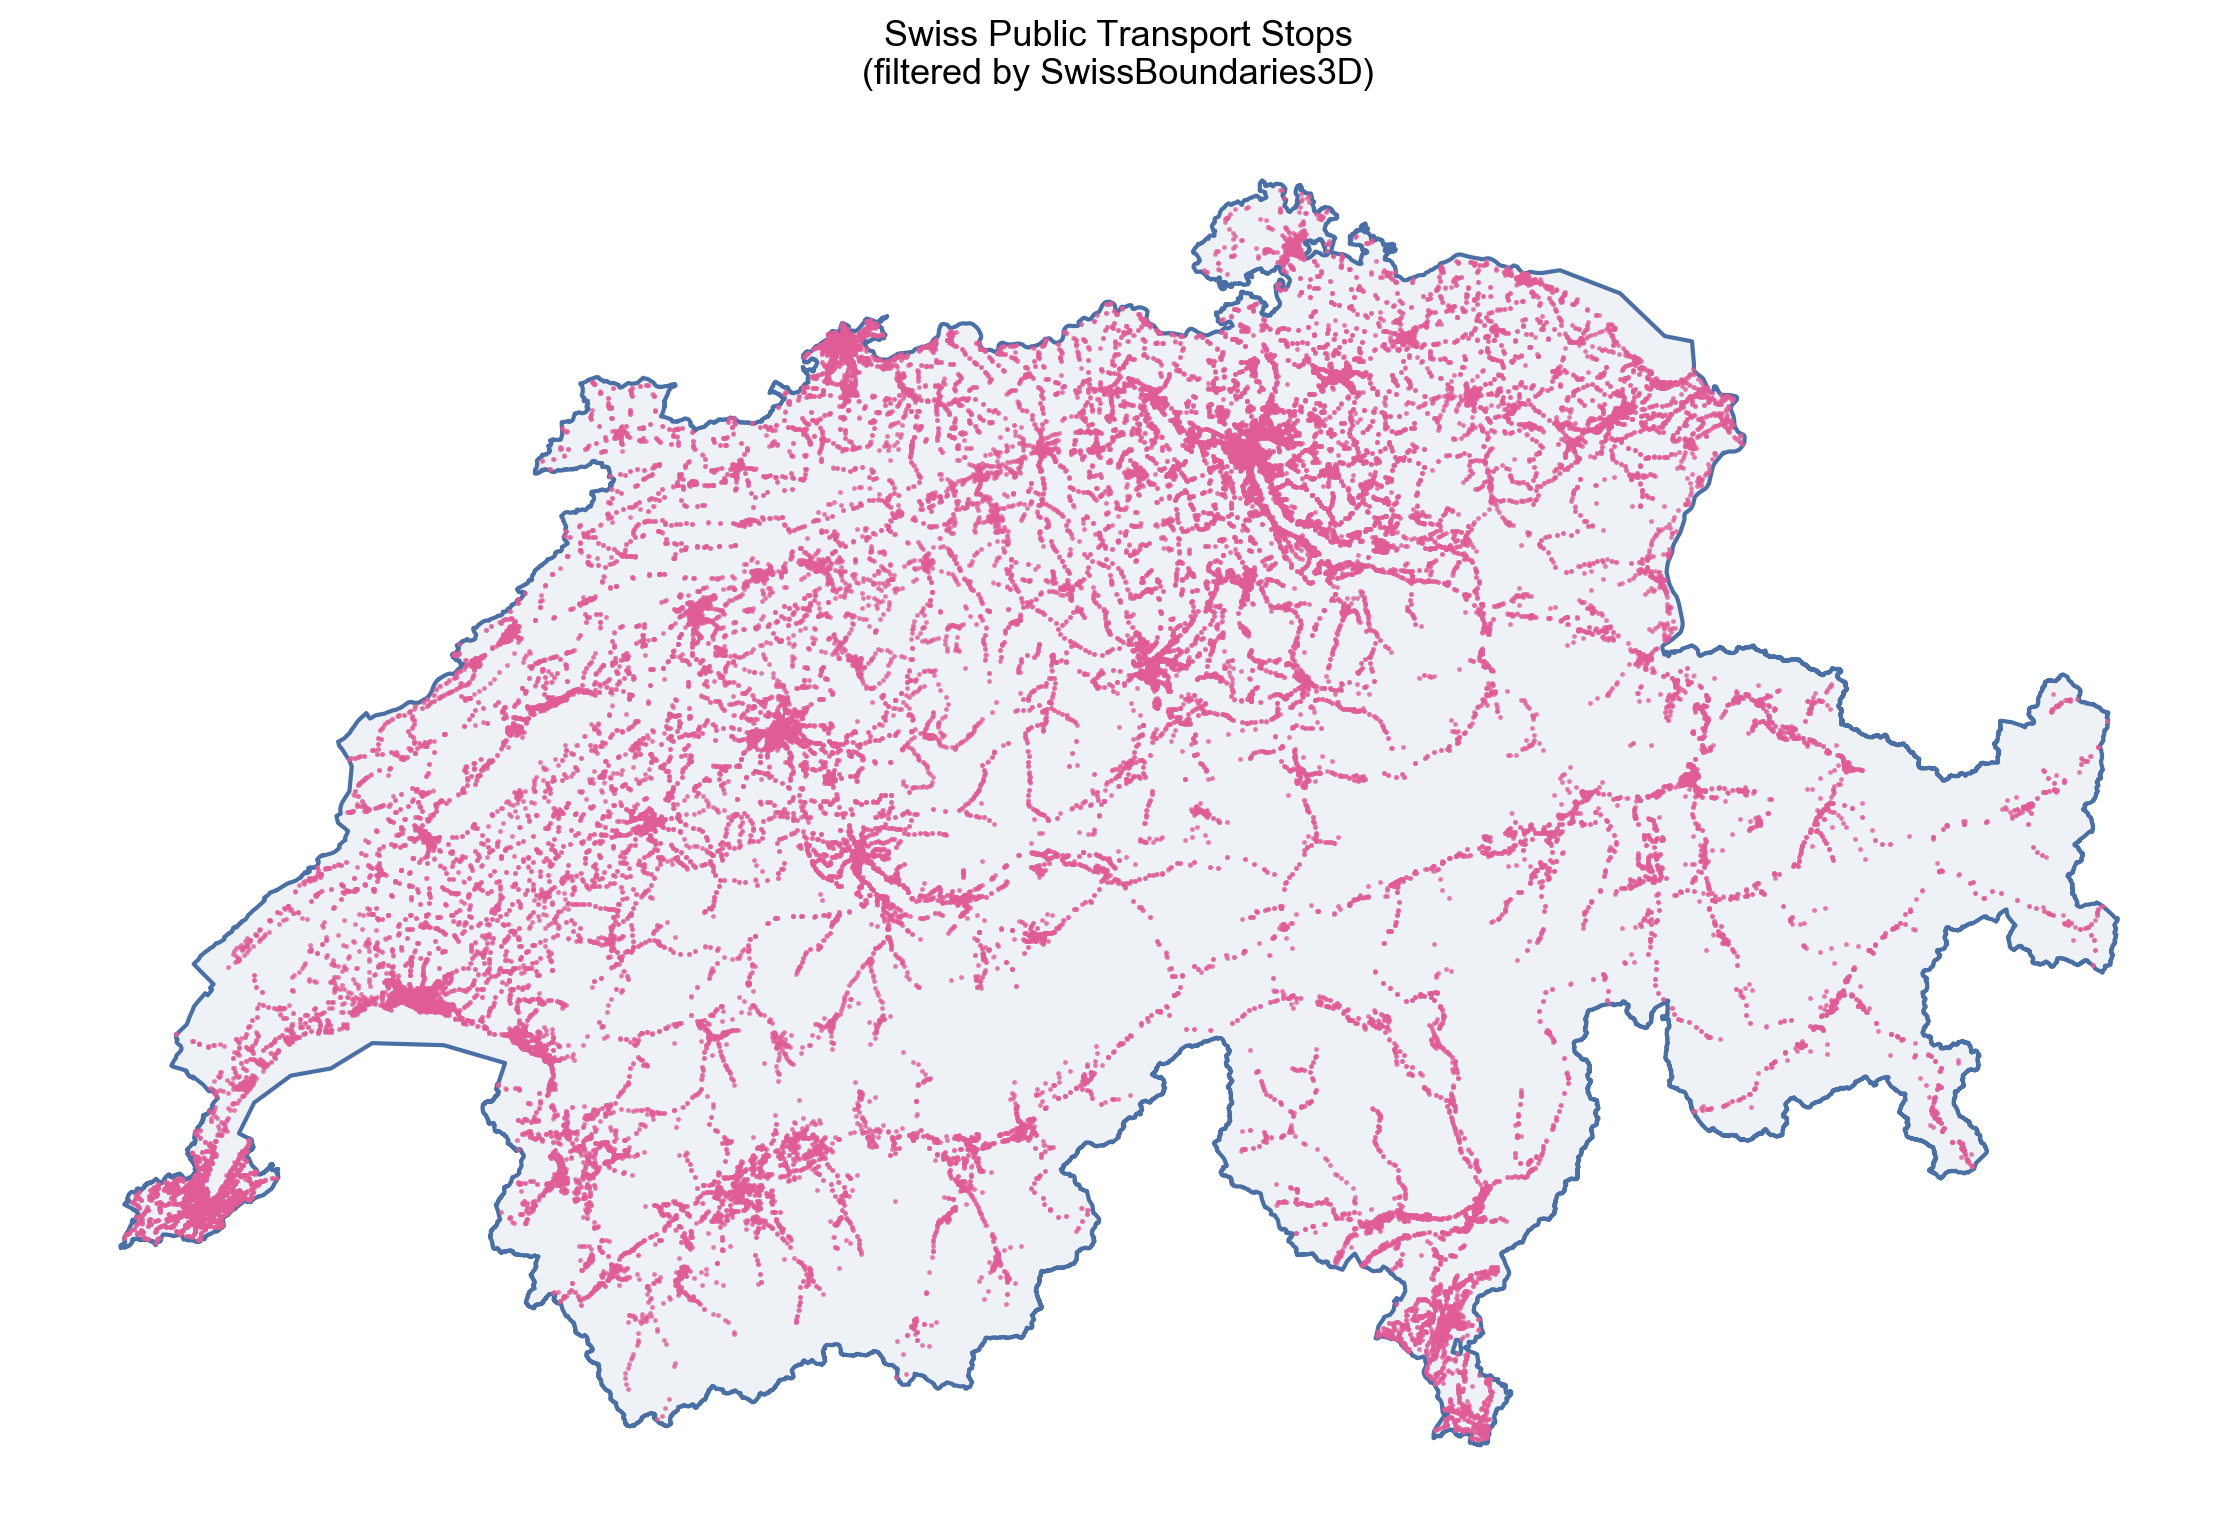
1. Filtering to a usable rail network
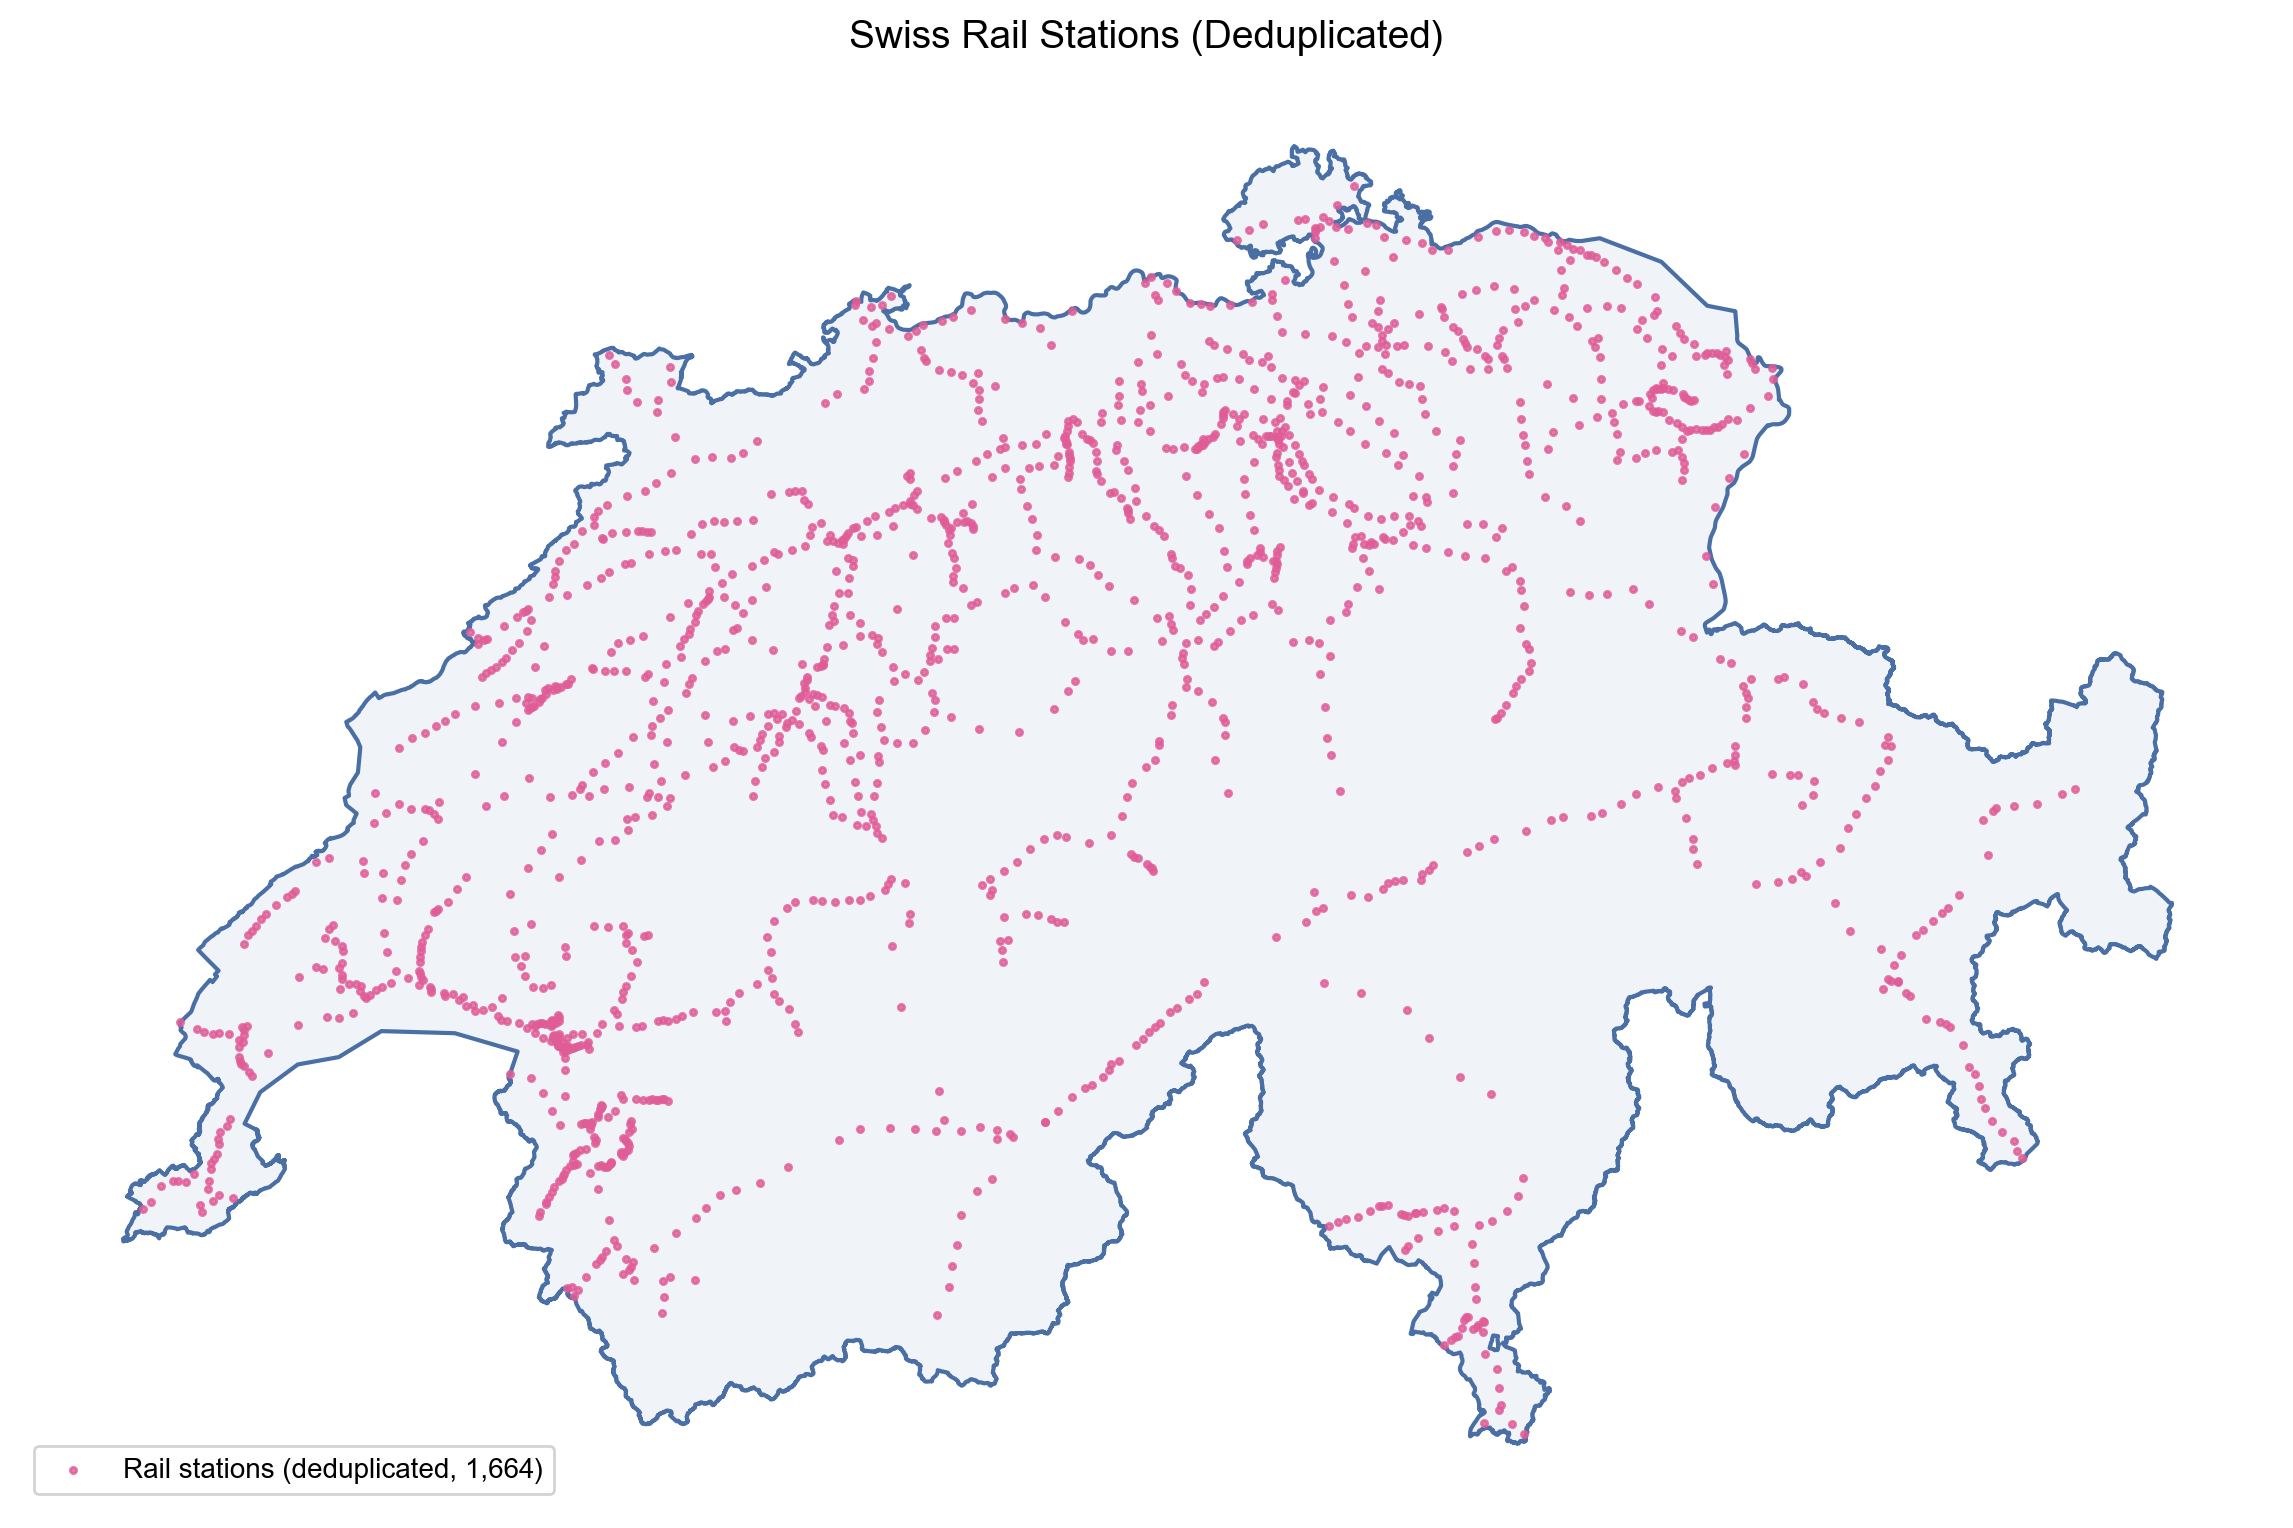
The raw GTFS feed contains cross-border stops and platform-level duplicates. Filtering to Swiss territory, isolating rail services, and collapsing platforms into logical stations makes the network usable for analysis and mapping.
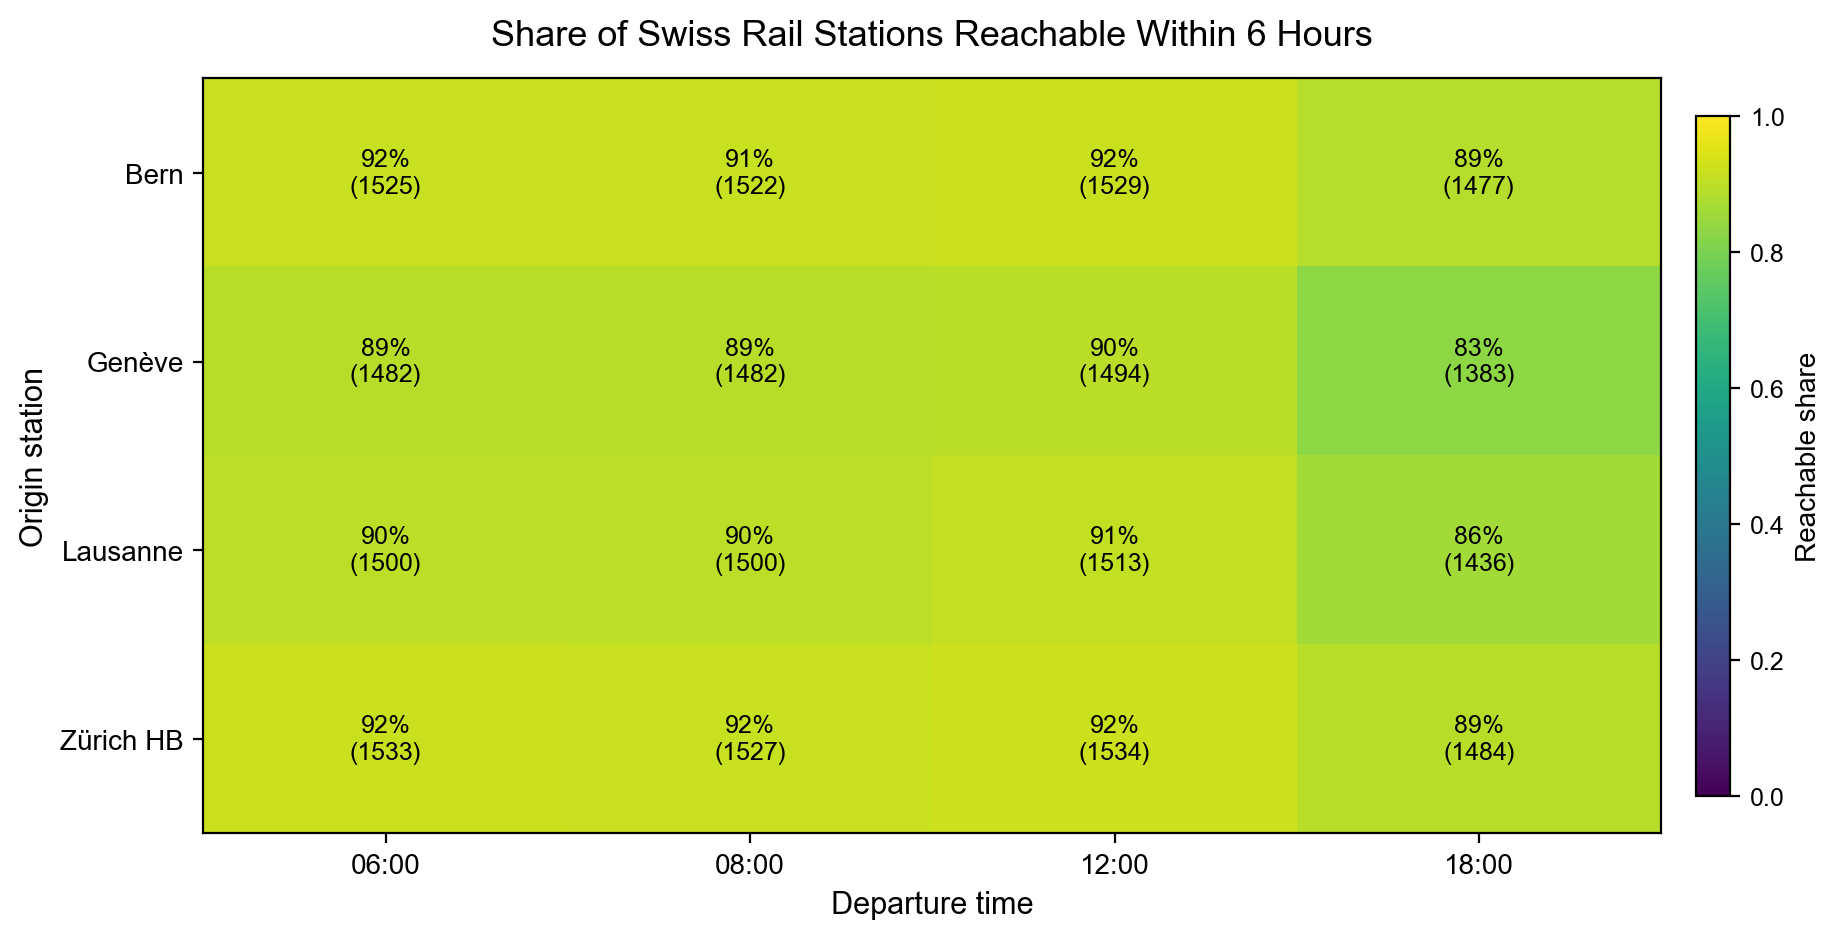
2. Reachability baseline
From Lausanne at 08:00, the rail-only model reaches 1,663 stations within 6 hours. In the four-city comparison, the strongest sampled case is Zurich HB at 12:00 with 1,535 reachable stations (92.3% of the network), while the weakest is Geneve at 18:00 with 1,383 (83.2%).
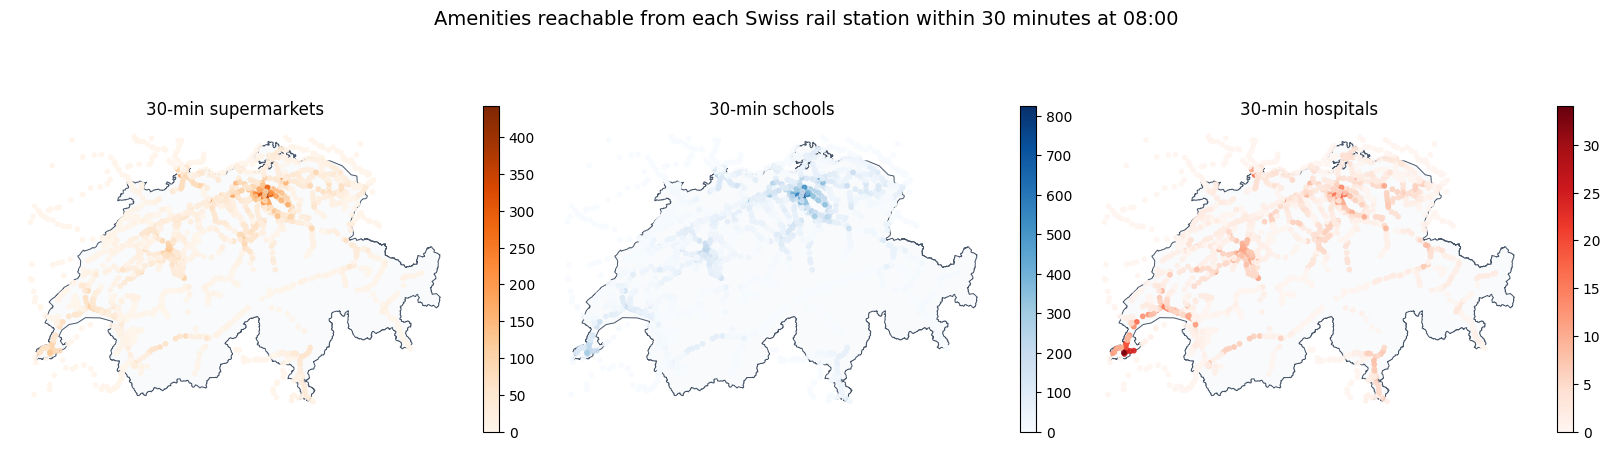
3. Everyday infrastructure insights
The new insight layer asks what a resident can actually reach. With a fixed 08:00 departure and a 30-minute threshold, the current export measures access to 3,430 supermarkets, 6,112 schools, and 305 hospitals.
4. Destination retail and brand geography
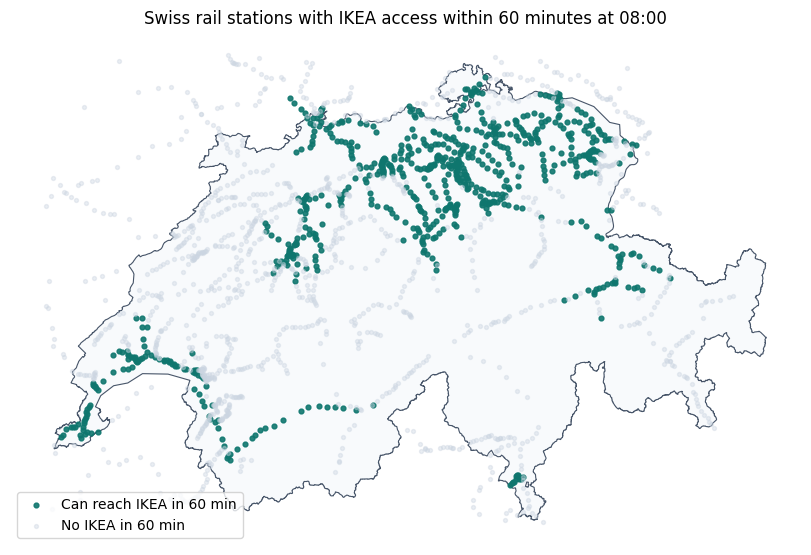
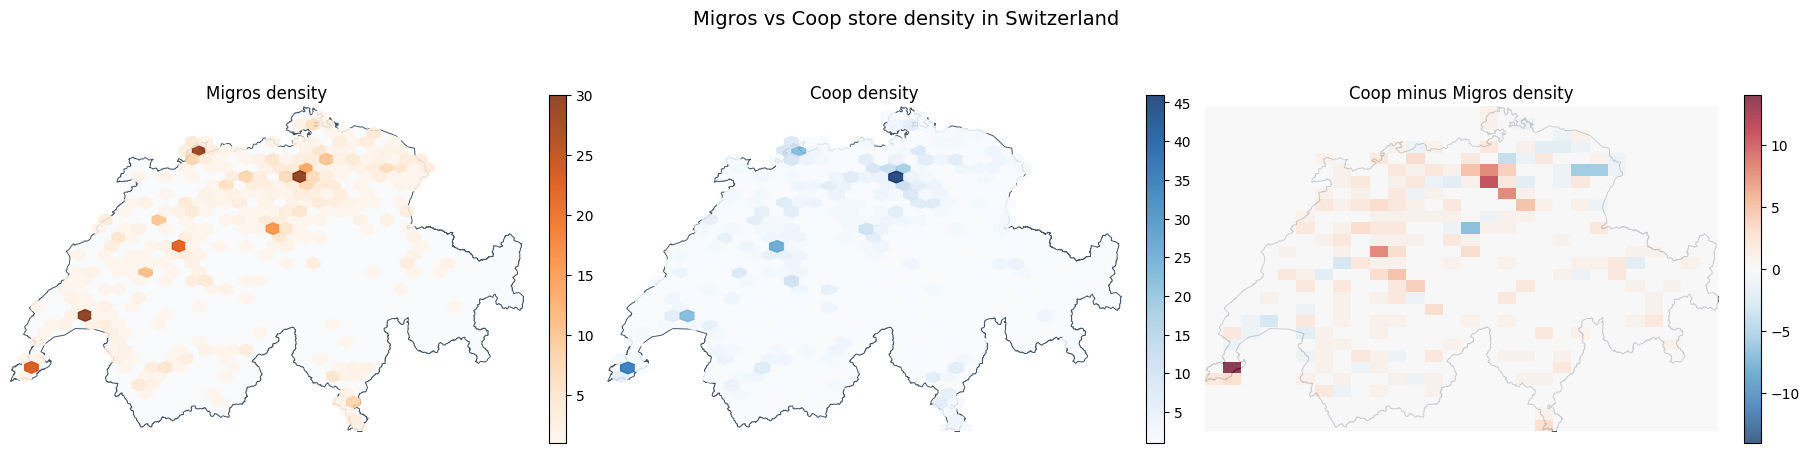
SwissReach also looks at destination retail and brand structure. The current export detects 21 IKEA POIs, and 743 logical rail stations can reach at least one IKEA within 60 minutes. The supermarket layer also supports a national density comparison between Coop (943 stores) and Migros (743 stores).
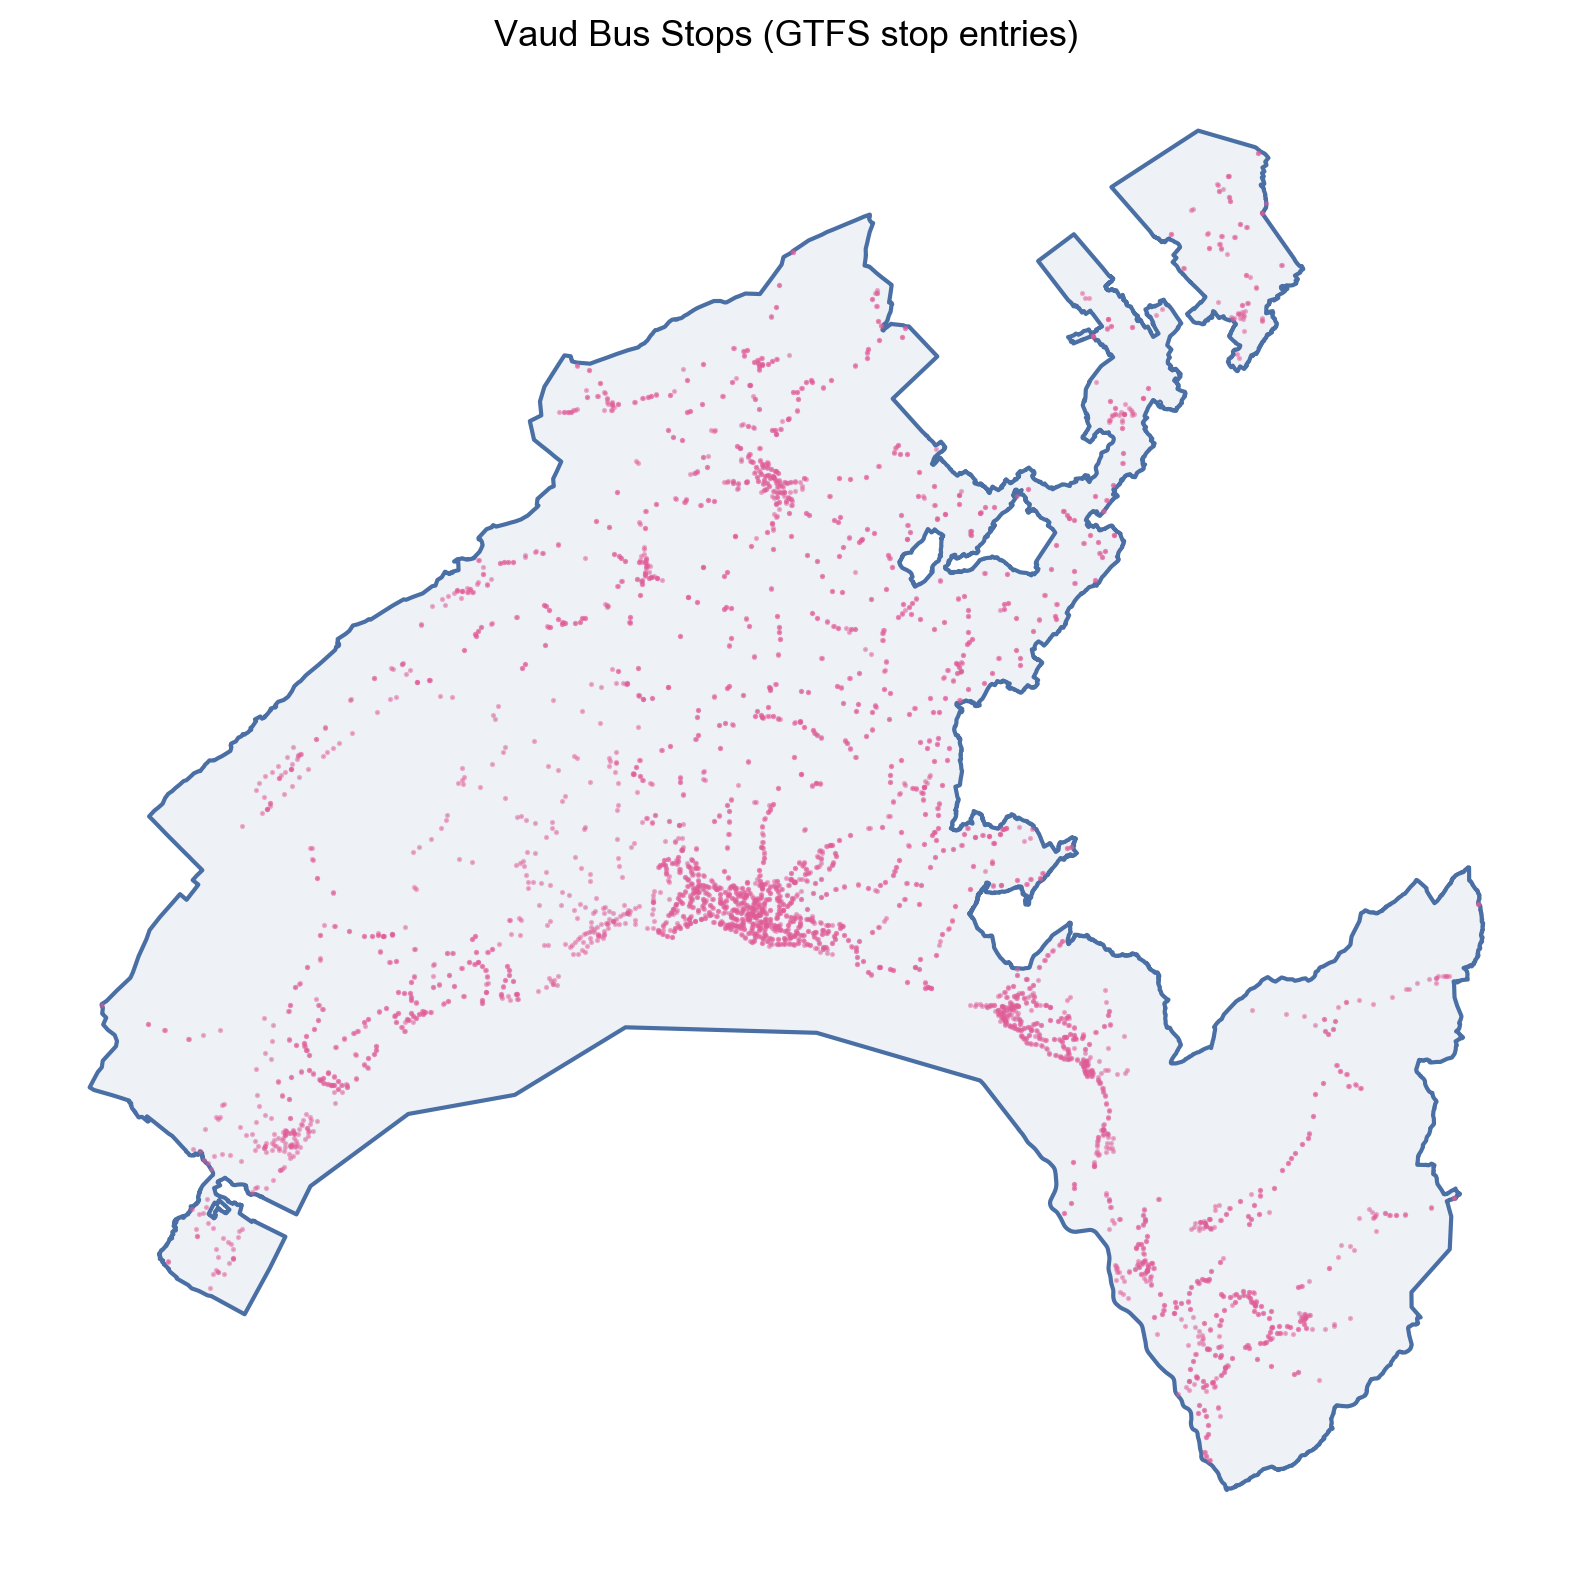
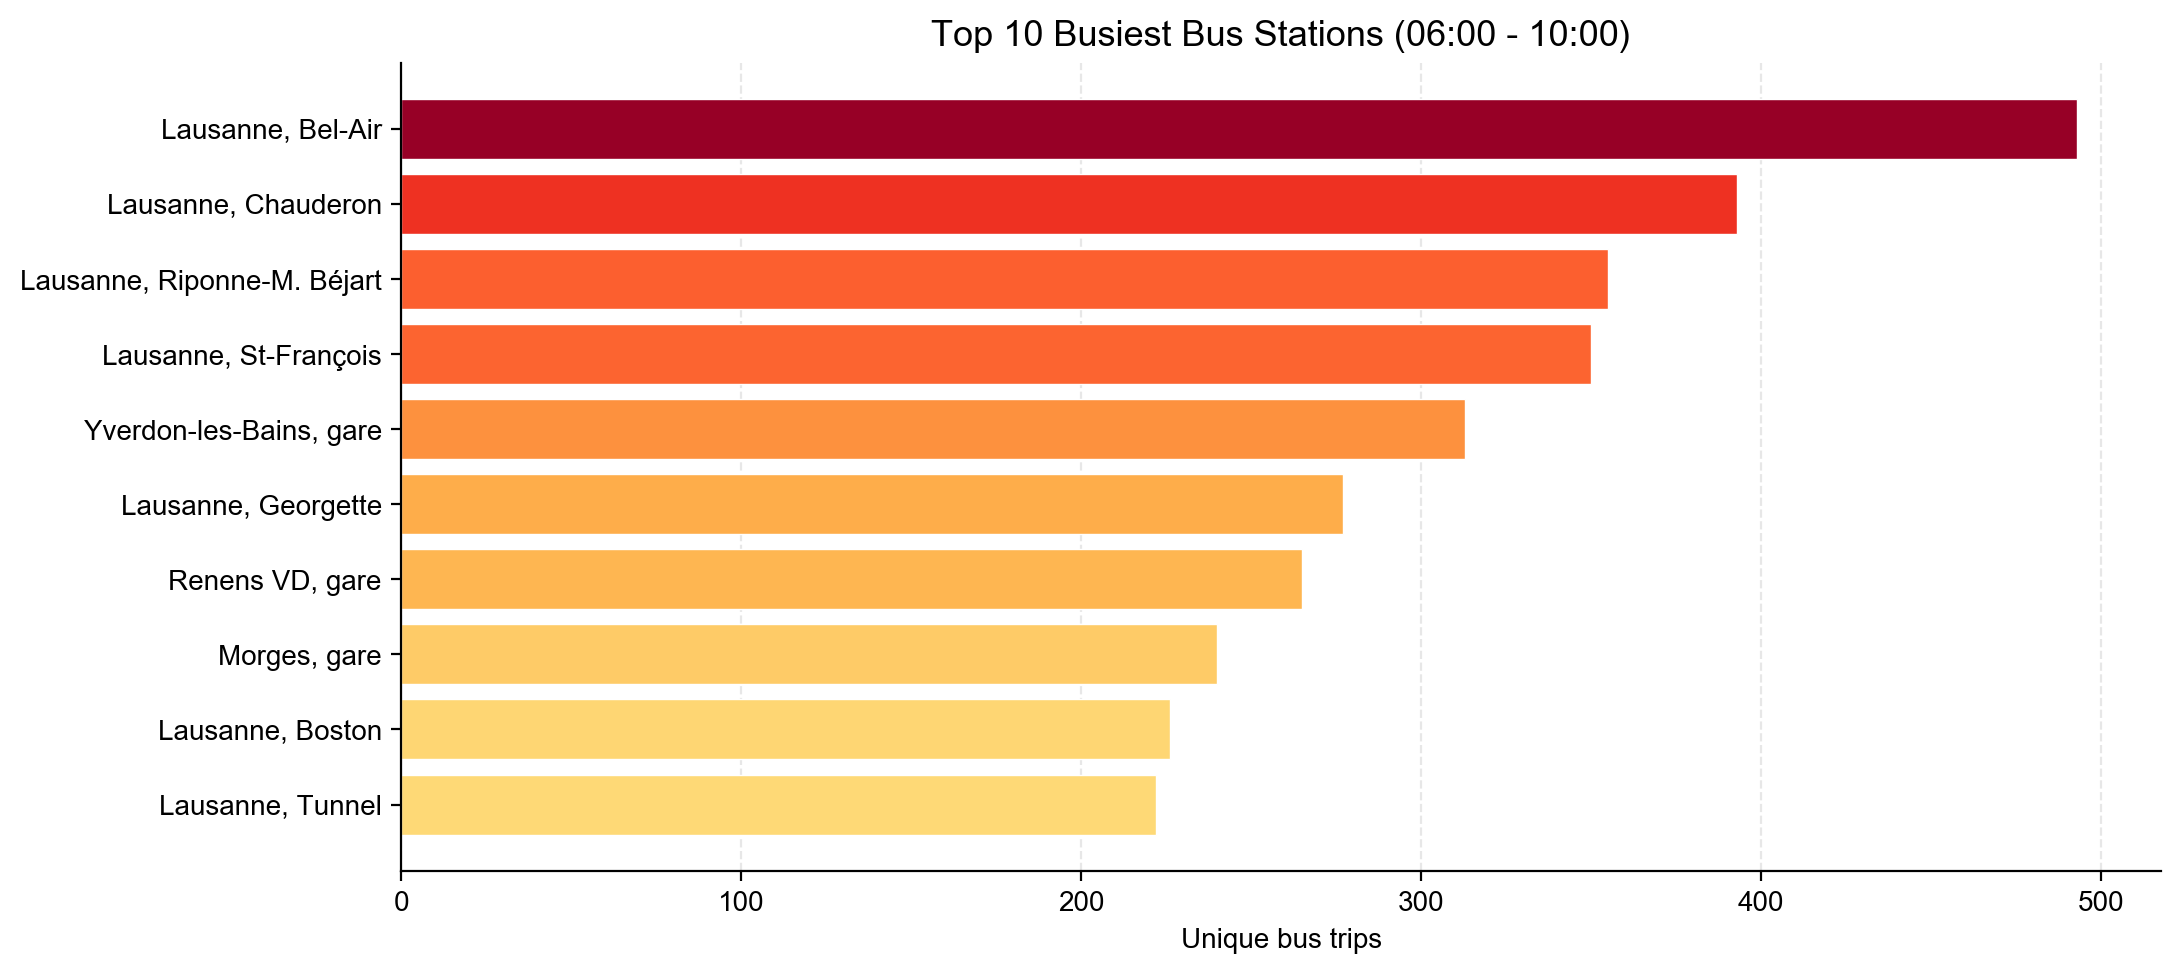
5. Vaud bus pilot with walking links
To test whether disconnected bus sub-networks can be bridged in a realistic way, we added a Vaud-only bus pilot alongside the national rail baseline.
The pilot follows the same pipeline style as the rail analysis:
- spatial filtering to Vaud canton
- bus route extraction (
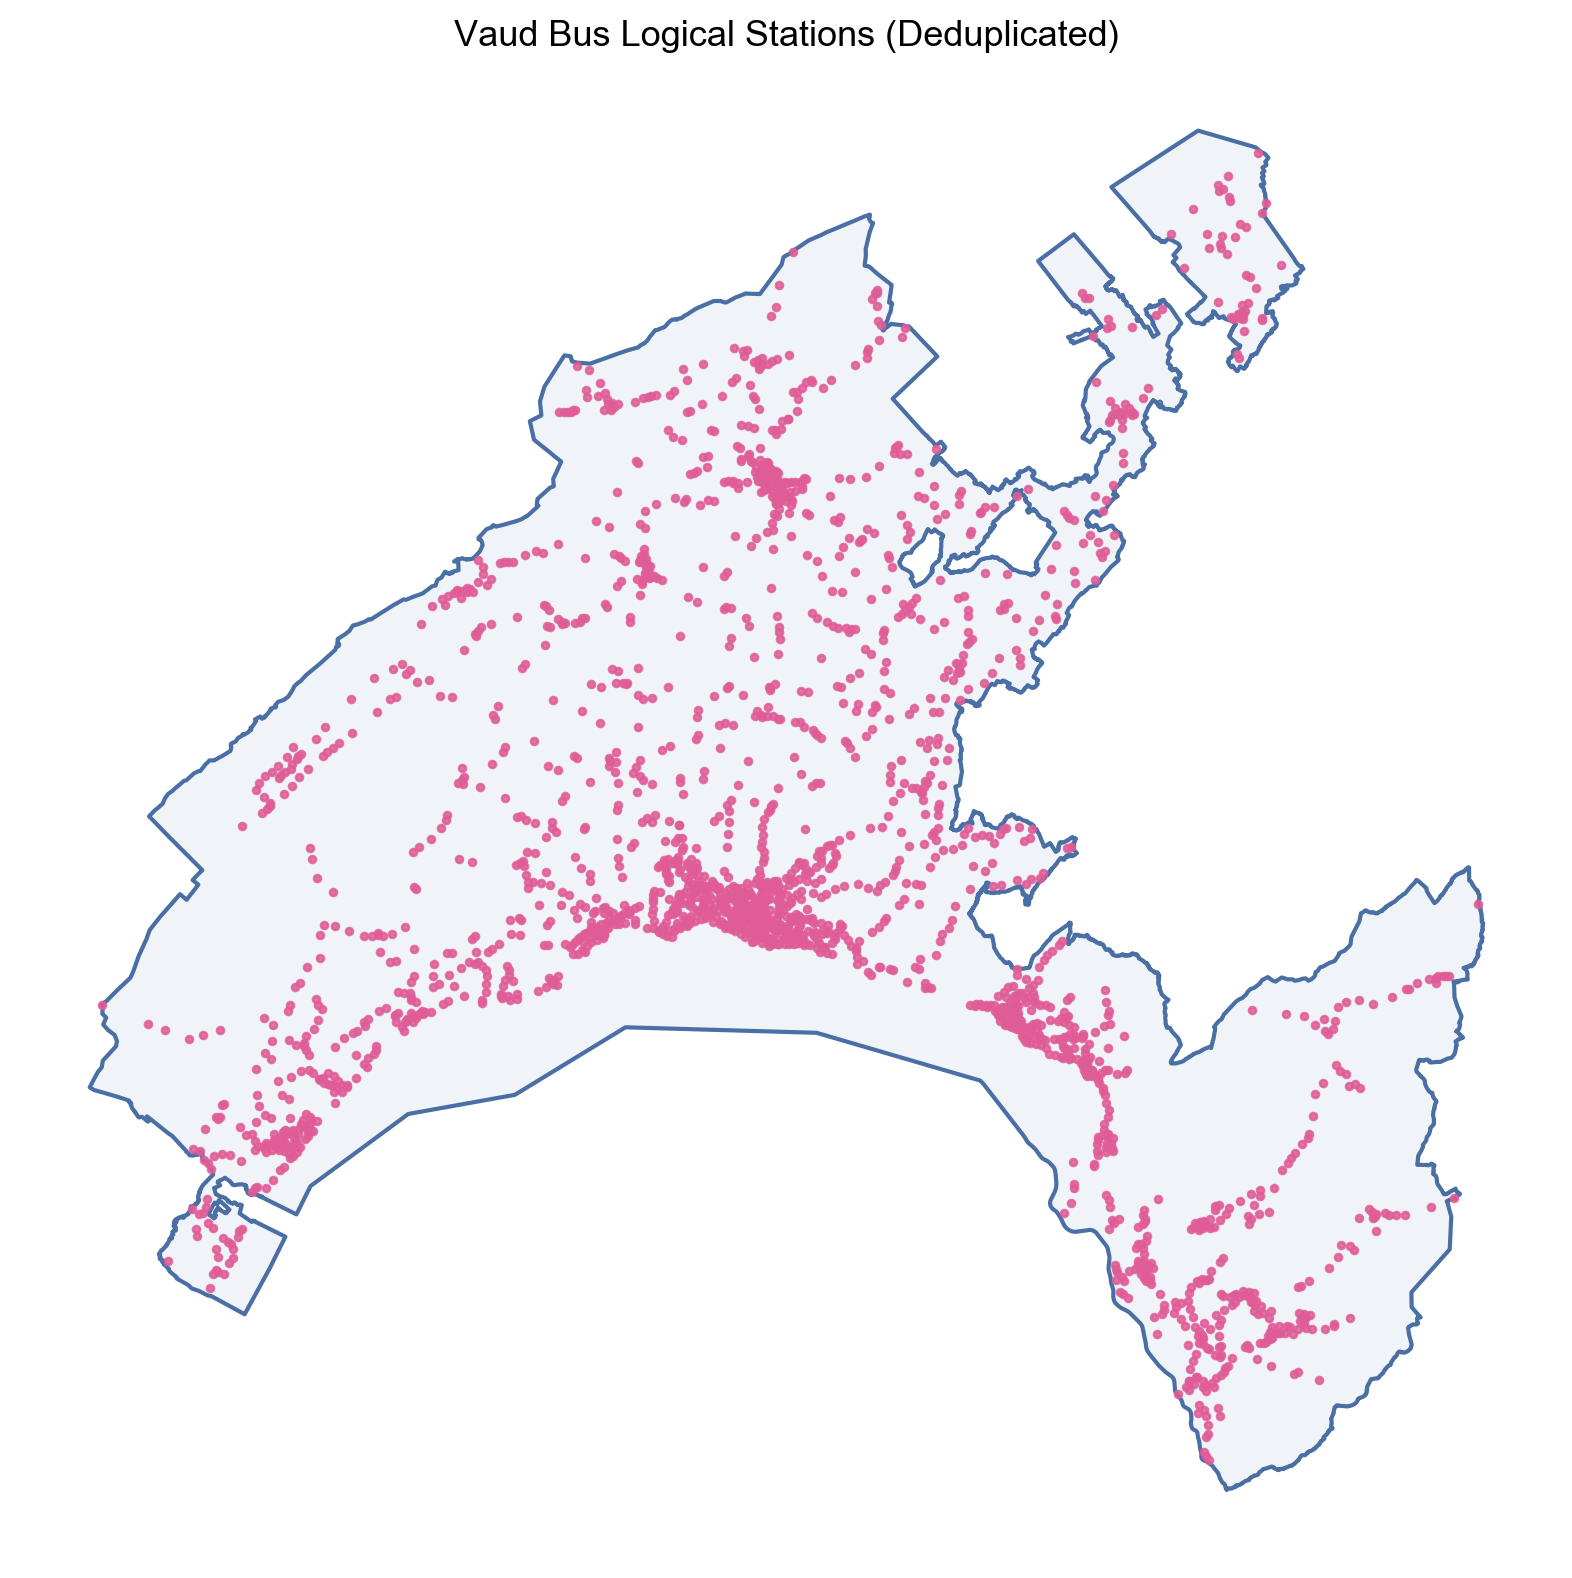
route_type3 and 700-716) - station-level deduplication via
parent_stationfallback - timetable-based reachability on a time-expanded graph
- optional walking links between nearby logical stations
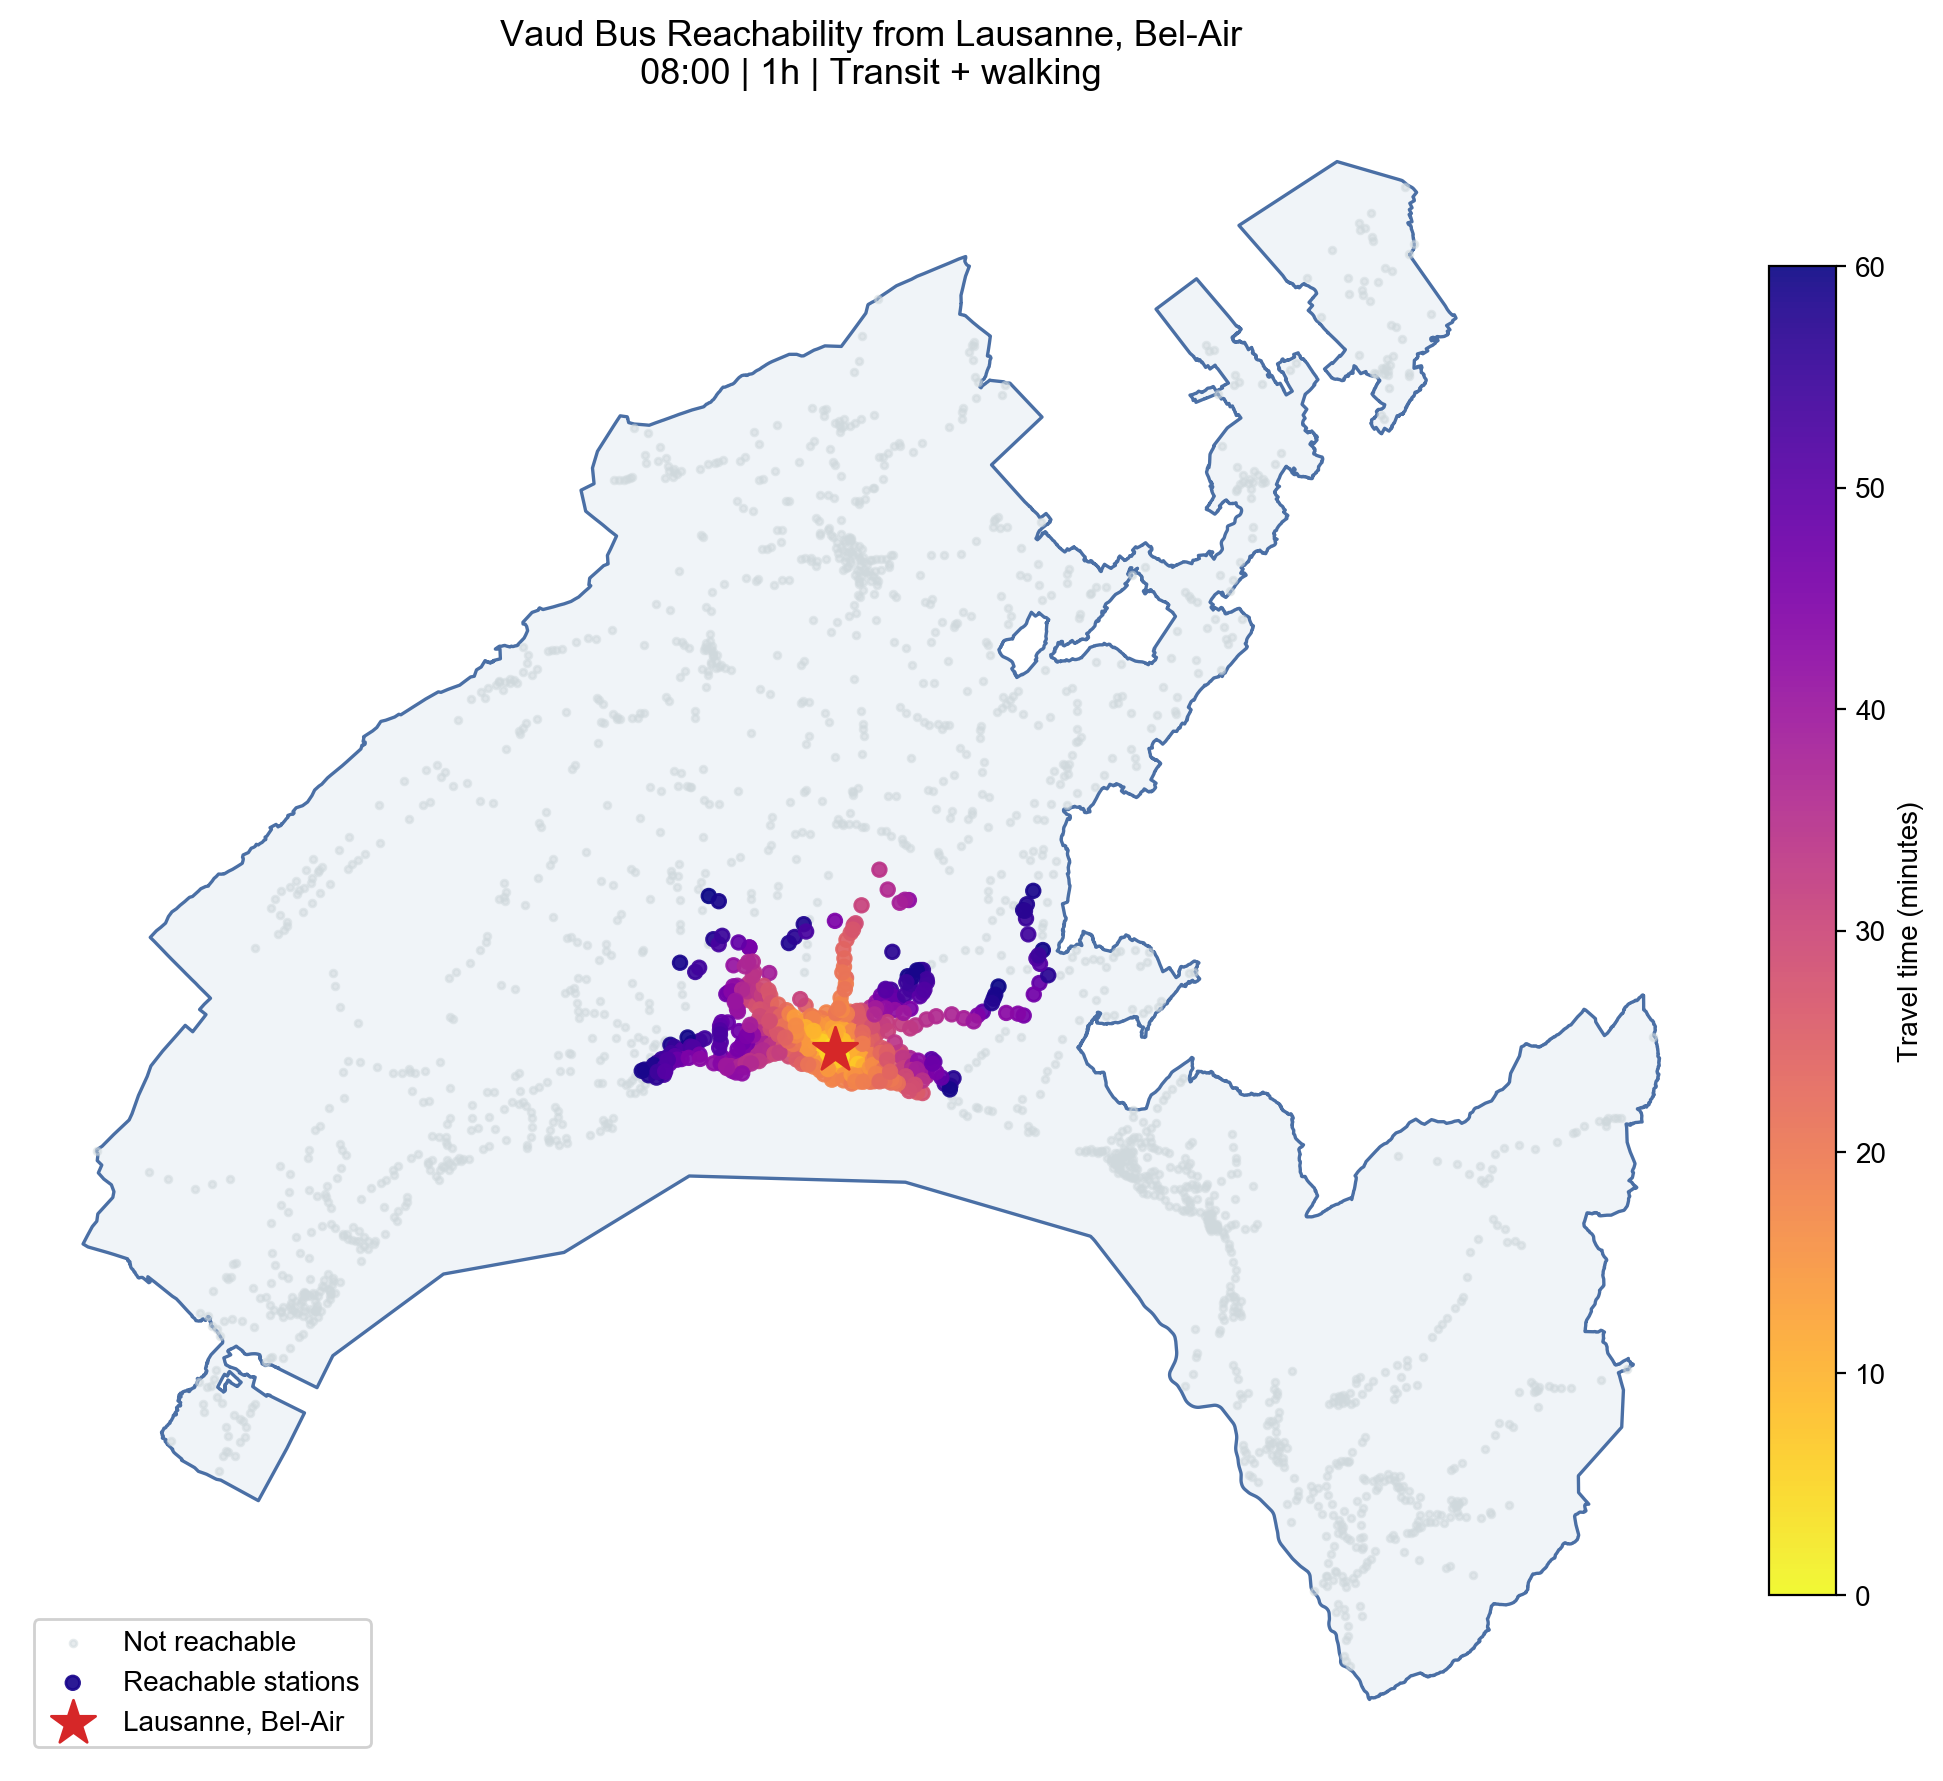
For walking, we use a typical pedestrian speed of 5.0 km/h and connect station pairs whose inferred walk time is at most 12 minutes.
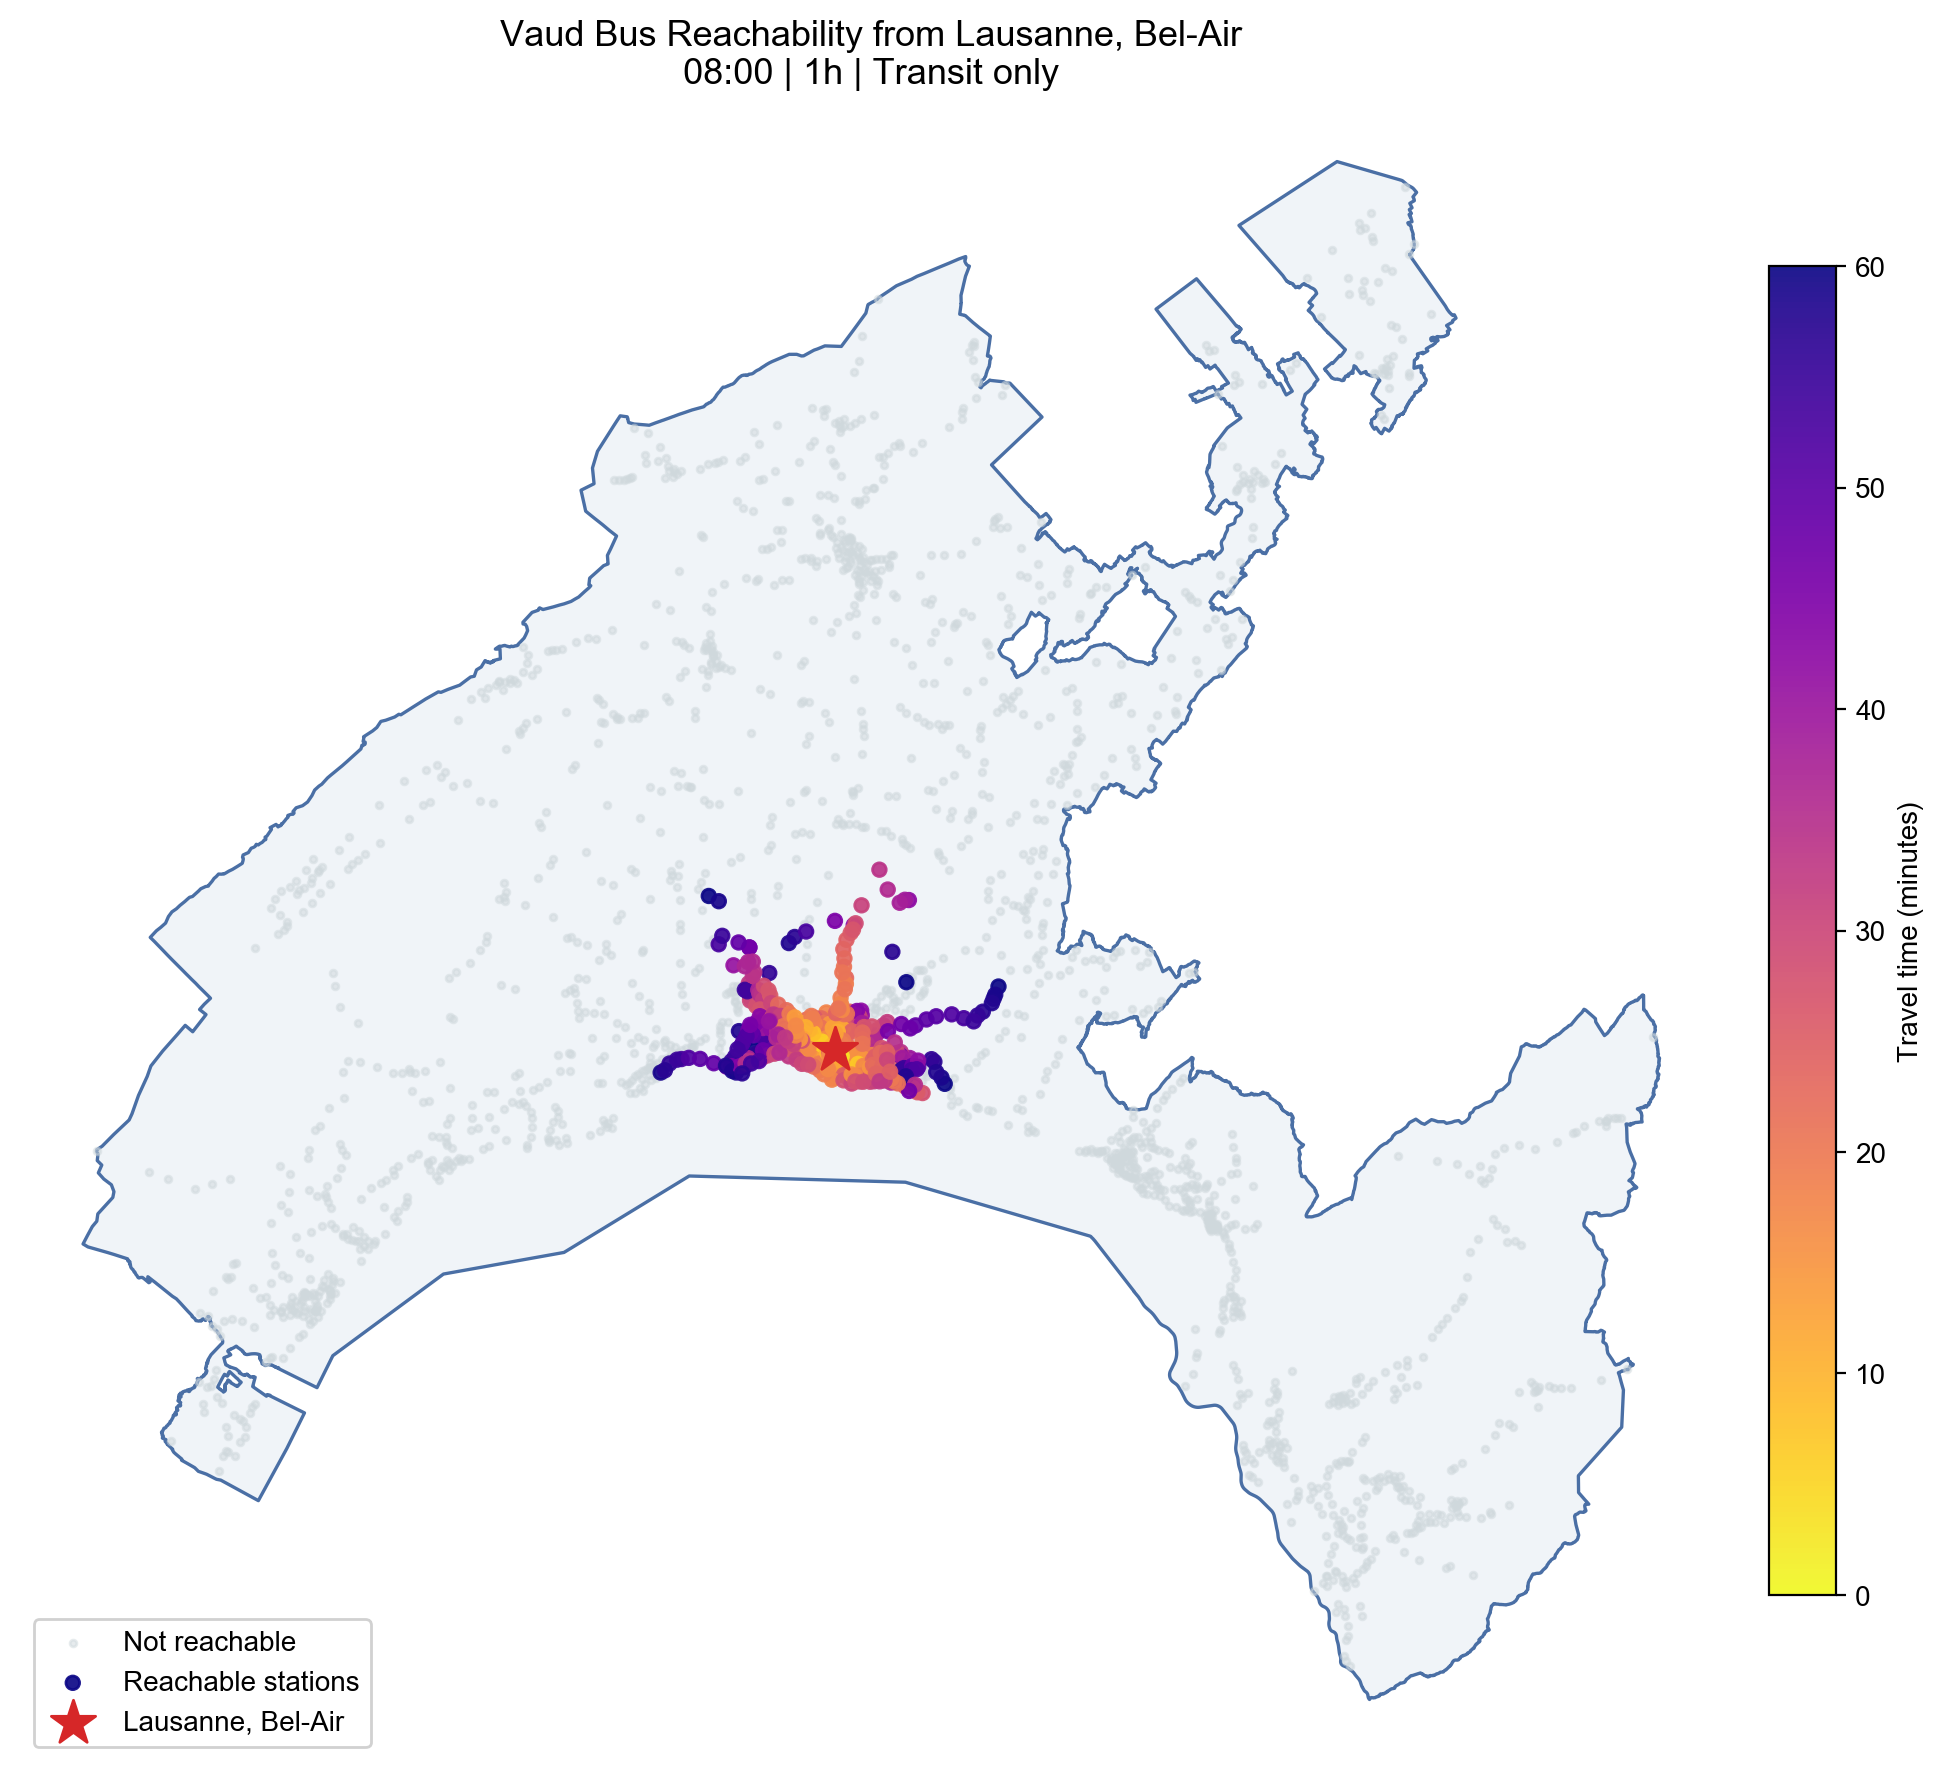
At 08:00 with a 1h horizon from Lausanne, Bel-Air, the walking-enabled model reaches more logical bus stations than transit-only routing in the same setup.
Across four Vaud origins and four departure times (1-hour window, walking enabled), the strongest sampled case is Lausanne, Bel-Air at 06:00 with 560 reachable logical stations (25.4% of the Vaud bus station set in this pilot export).
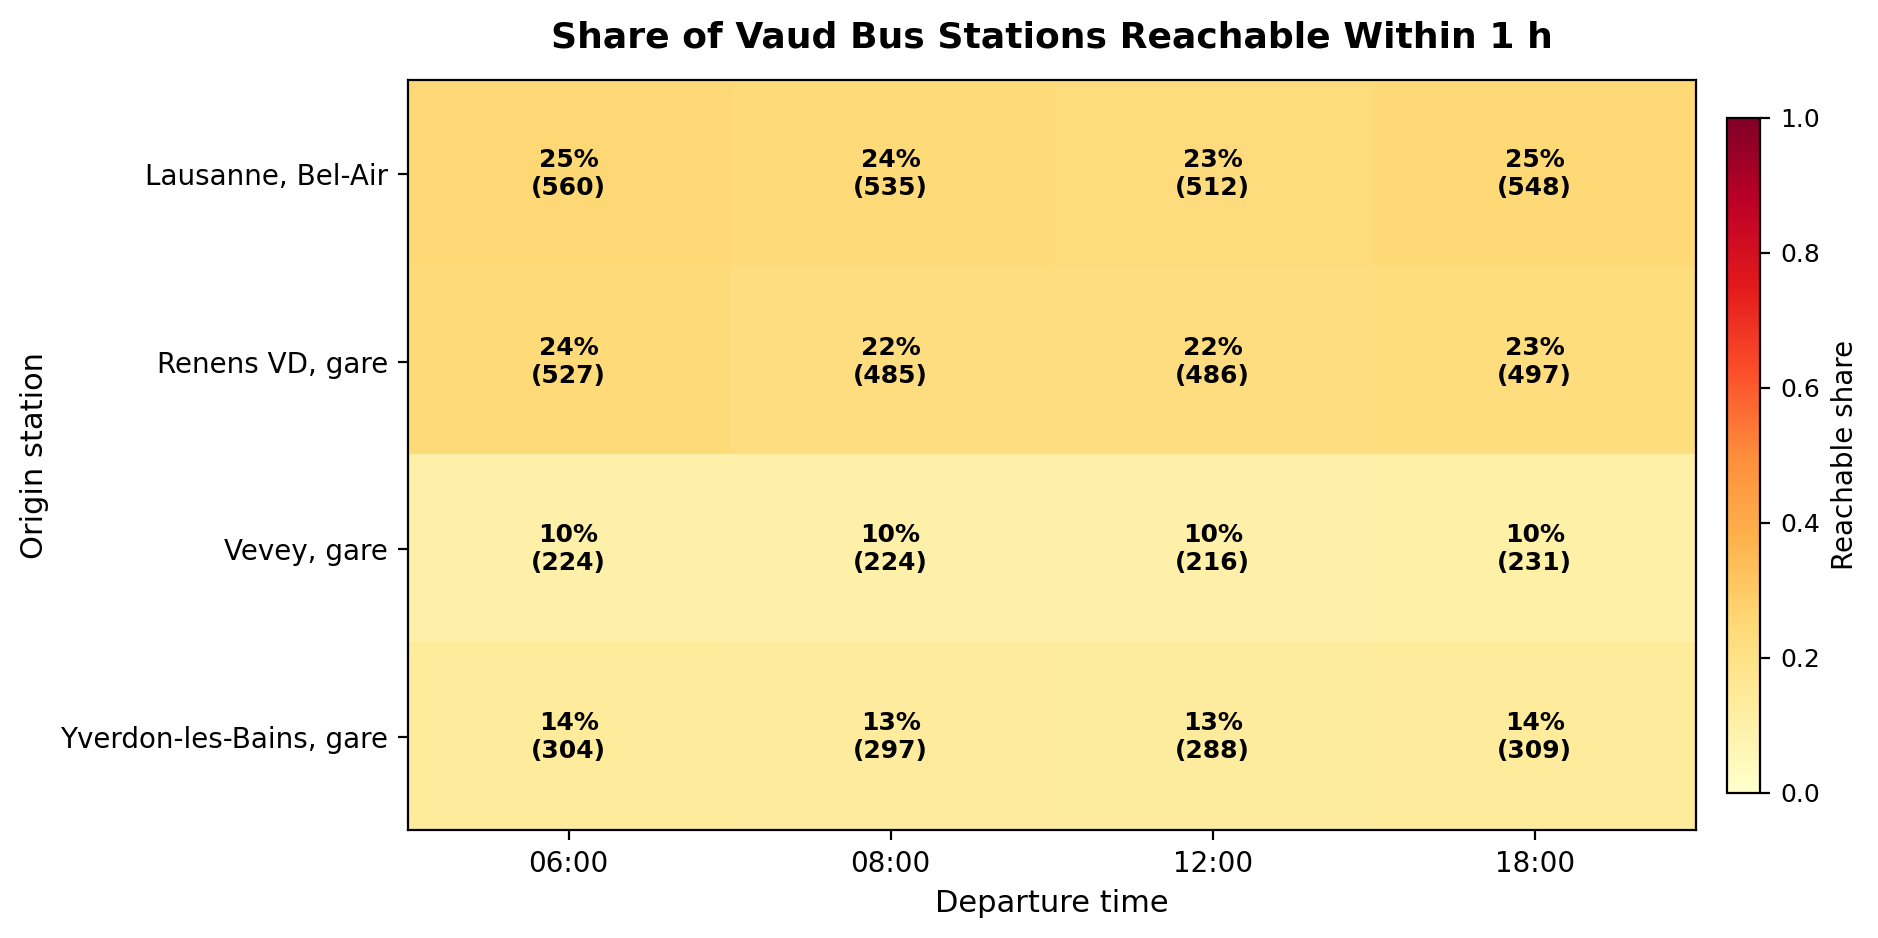
The corresponding table exports are available as CSV and JSON.
Scope
Milestone 1 presents the project primarily as a nationwide Swiss rail accessibility visualization, with an additional Vaud bus pilot used to validate transfer assumptions (including walking links) in a smaller regional setting.
The following components remain out of scope at this stage:
- nationwide multimodal integration (buses, trams, cable cars, boats) as first-class modes
- end-to-end pedestrian routing beyond short transfer links
- cross-border continuation outside Swiss territory
- full path reconstruction for itinerary explanations
Related Work
Public-transport isochrones are an established idea, with tools such as Mapnificent and TravelTime showing how origin, departure time, and mode choice can be visualized. SwissReach does not try to replace those systems. Its originality lies in combining a nationwide Swiss rail perspective with station-level deduplication and a second analytical layer based on amenities and retail. In design terms, the project draws from three families of views: isochrone maps, hub rankings, and comparison matrices. That combination fits the course well because it is visually rich, technically feasible, and clearly differentiated from a generic route-planning interface.